

The Mollier diagram is used to analyze the performance of the adiabatic steady-flow process, one of which is to determine the work value and power of the Steam Turbine by looking for Enthalpy and Entropy in the system.
Some of the thermodynamic terms associated with the Mollier Diagram:
· Enthalpy (kJ / kg) is a measure of the total energy of a thermodynamic system.

. Entropy (kJ / kg.K) is a measure of the microscopic irregularity of a substance.
. Power (W) is the rate at which energy is transferred or work performed per unit of time.
· Work (J) is the amount of energy transferred from one system to another.
· Isoenthalpy is a state where the Enthalpy of a system is constant.

· Isoentropy is a condition where the entropy of a system is constant.
In calculating the power and work of the Steam Turbine, the Themodynamic calculation approach is used when the ideal conditions are when the efficiency of the Steam Turbine is 100% or non-ideal, namely when the efficiency of the Steam Turbine is less than 100%. But in actual situation, no Steam Turbine efficiency reaches 100%.
The following table shows the equations of the Isoentropy and Isoenthalpy systems under ideal and non-ideal conditions. The Isoentropy equation when ideal and non-ideal conditions are distinguished by the existence of a multiplier in the form of efficiency at non-ideal times, while the Isoenthalpy equation when ideal and non-ideal conditions are constant so that the result of power and work is zero (0).
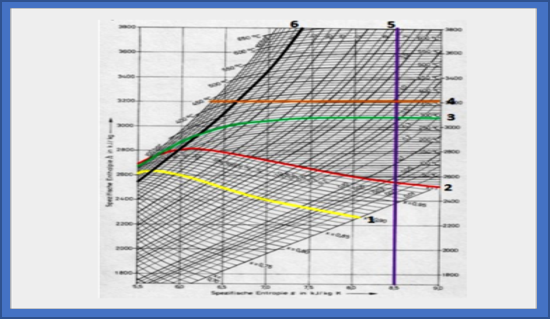

Figure 1. Description of the Mollier Diagram Coordinates
Information:
1. The constant vapor humidity line shows the constant humidity of the steam exhaust.
2. The saturation line shows the liquid that is being heated.
3. The constant temperature line shows the temperature of the liquid.
4. Enthalpy line shows the line to define Enthalpy.
5. The Entropy line shows the line for determining Entropy.
6. The constant pressure line shows the absolute pressure of the liquid.
Application examples of using the Mollier Diagram:
It is known that in ideal conditions a steam turbine has a power output rate of 30,000 kW and a mass flow rate of 26.4 kg / s. Steam exhaust into the condenser is 0.12 bar at absolute pressure and has a constant vapor moisture content of 81%.
Specific Enthalpy of the steam inlet and outlet?
Is known:
Power output: 30,000 kW
Mass flow rate: 26.4 kg / s
Steam exhaust pressure: 0.12 bara
Constant vapor humidity: 81%
Wanted: Specific enthalpy from steam inlet and outlet?
Settlement:
Power = (mass flow rate). (Enthalpy difference). (Efficiency)
Because the system is in an ideal state, efficiency = 1
So that:
30,000 kW = (Enthalpy difference). (26.4 kg / s). (1)
Enthalpy difference = (30,000 kW) / (26.4 kg / s) = 1136 kJ / kg
Further calculations using the Mollier Diagram (Figure 2):

Figure 2. An Example of Using a Mollier Diagram
1. A dash at constant pressure indicating 0.12 bar.
2. The line mark at constant vapor humidity of 0.81.
3. A horizontal line (Enthalpy line) from the point where the two pressure and humidity lines meet to determine the Enthalpy value. So that from the meeting point of the three lines, the Enthalpy value is obtained:
h2 = 2160 kJ / kg
Then:
h1- h2 = 1136 kJ / kg
h1 = 1136 kJ / kg + 2160 kJ / kg = 3296 kJ / kg
So that from the above calculations have been obtained:
Outlet specific enthalpy (h2) = 2160 kJ / kg
Intlet specific enthalpy (h1) = 3296 kJ / kg